1.5 Total Parcel Based On Sender State
Figure 1.5.0 below shows the way to Total Parcel Based on Sender State :
 Figure 1.5.0
Figure 1.5.1 below shows Total Parcel Based on Sender State interface :
 Figure 1.5.1
A chart of Total Parcel Sent based on Sender State will be generated based on collection date.
For example in Figure 1.5.2, admin wants to create a pie chart, so they just need to click on Pie button from the chart type :
 Figure 1.5.2
Next, select date range for Collection Date, e.g based on Figure 1.5.3, From (2017-06-02) and To (2017-08-01) :
 Figure 1.5.3
Then, click Search button to create the Pie chart as shown in Figure 1.5.4 :
 Figure 1.5.4
Admin can hover over each slice of the pie chart to see details such as State name and its total number of parcel;
For example in Figure 1.5.5, admin hovers over Johor :

Admin are also able to click each slice to create a more detailed pie chart.
For example in Figure 1.5.6, admin click on Johor, a pie chart of state Johor and its total parcel collected by each courier is displayed :
 Figure 1.5.6
If admin click on Back to Total Parce as in Figure 1.5.6, it will redirect to the previous chart.
For generated charts, admin are able to download or print them by using the menu positioned on the top right of the box.
Example in Figure 1.5.7, admin click on Download PNG Image option from the menu :
 Figure 1.5.7
Figure 1.5.8 is an example of downloaded image :
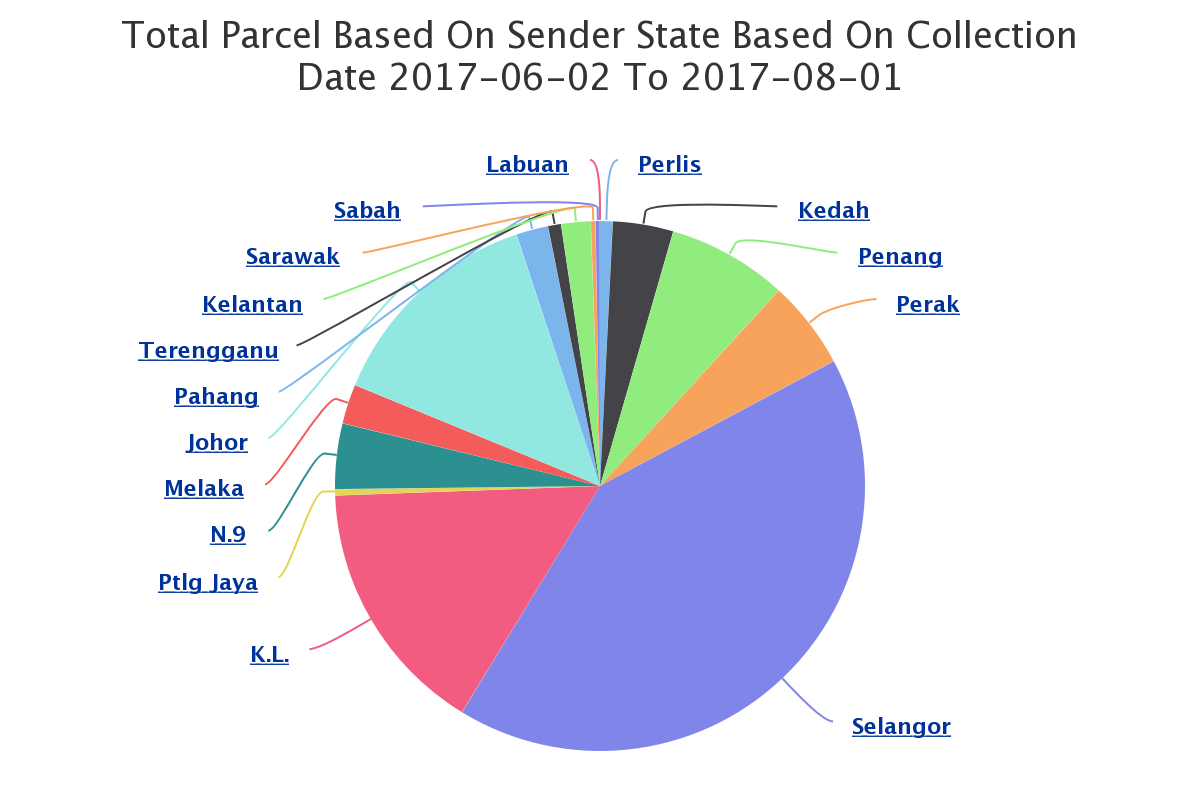 Figure 1.5.8