1.2 Total Active Customers Sent Parcels
Figure 1.2.0 below shows the way to Total Active Customers Sent Parcels :
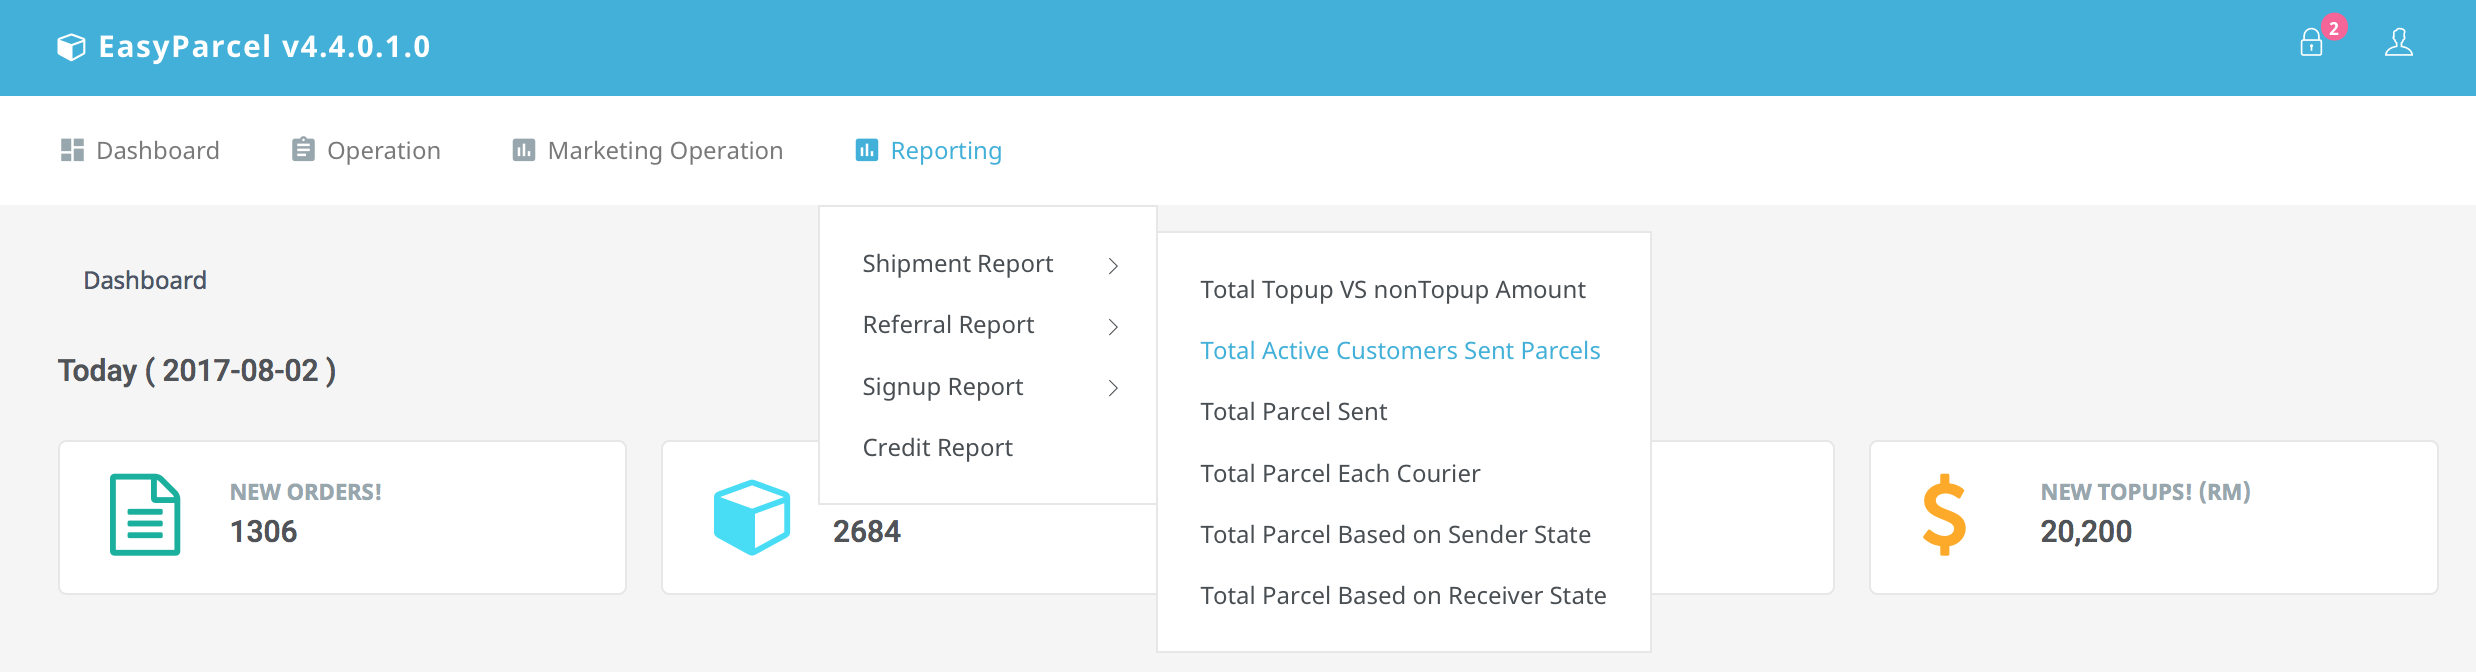
Figure 1.2.0Figure 1.2.1 below shows Total Active Customers Sent Parcels interface :

Figure 1.2.1A chart of Total Active Customers Sent Parcels will be generated by selecting date range.
Admin are able to choose the type of chart such as Column, Pie or Bar that want to be prompted as in Figure 1.2.1
For example in Figure 1.2.2, admin chooses Pie, click on button with "Pie" on it :

Figure 1.2.2Then select the date range for FROM and To, example in Figure 1.2.3 , From(2017-06-02) and To(2017-08-01) :

Figure 1.2.3Click Search button, and a pie will be displayed below the search bar as in Figure 1.2.4 :

Figure 1.2.4Admin can hover over each slice of the pie chart to see details such as date and its total number of customer.
For example in Figure 1.2.5, admin hovers over Jun2017 :

Figure 1.2.5Admin can also click on each slice of the pie chart , or the date to generate more detailed pie chart
For example in Figure 1.2.6, admin click on Jun2017 :

Figure 1.2.6If admin clicks on Back to Total Customer as in Figure 1.2.6, it will redirect to the previous chart.
For generated chart, admin can download them or print by using the menu positioned on top right of the box.
For example in Figure 1.2.7, admin click on Download PNG Image option :

Figure 1.2.7Figure 1.2.8 is an example of the downloaded image :
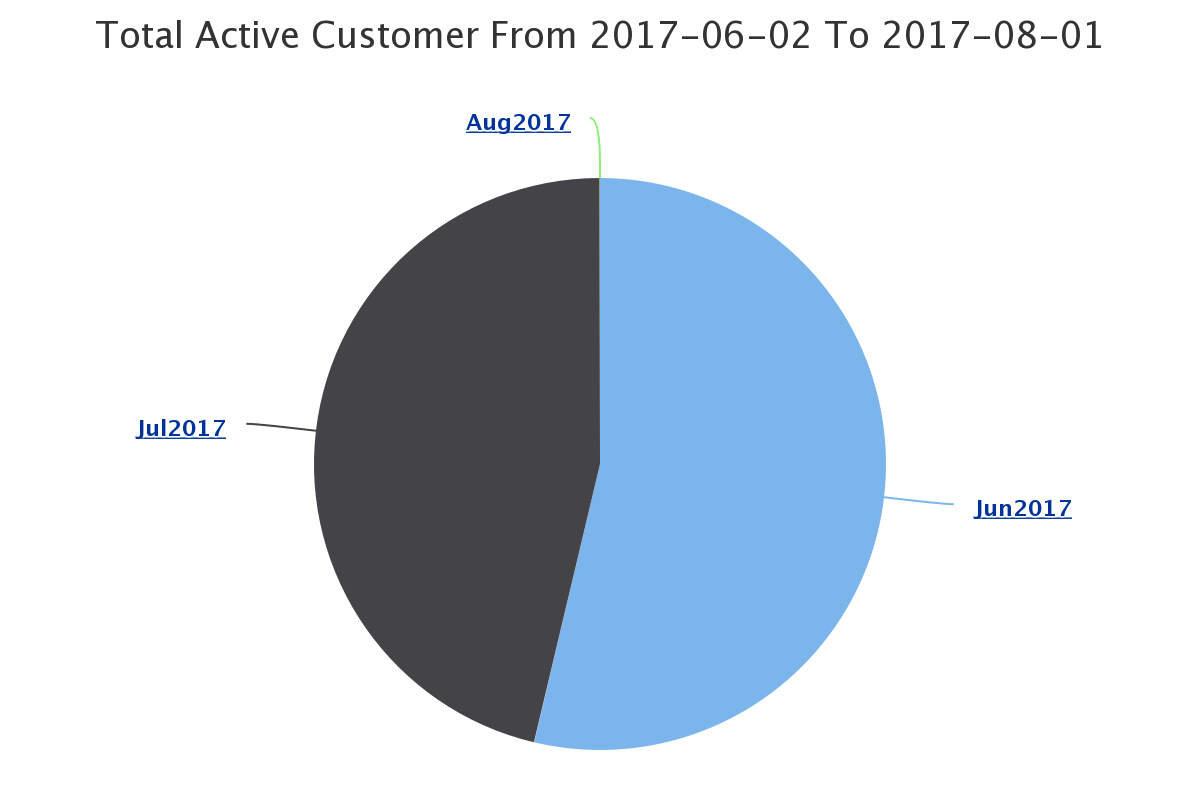
Figure 1.2.8