4.0 Credit Report
Credit Report consist of reports and summaries based on customer credit history.
Figure 4.0 below shows the way to Credit Report :

Figure 4.0Figure 4.1 below shows the main page of Credit Report :

Figure 4.1Based on Figure 4.1, there are eight tabs included in credit report :
- i. Today Topup
- ii. Topup Contribution
- iii. Topup Ranking
- iv. User Topup
- v. Credit Distribution
- vi. Topup Package
- vii. Credit Claimed
- viii. Monthly Report
i. Today Topup
A list of records from Today’s Topup.
When admin click on Today Topup tab, a list of record will be displayed as shown in Figure 4.2 :
Figure 4.2Admin can use the search bar to filter by email or date.
For example in Figure 4.3 admin wants to search by email, type in a customer email in the search bar and the result will appear :

Figure 4.3
II. Topup Contribution
A graph of topup contribution.
When admin clicks on Topup Contribution, a graph of topup contribution by week for the current month will be displayed as shown in Figure 4.4 :

Figure 4.4If admin hovers over the bar graph they can details such as week number followed by date range and total topup contribution, e.g in Figure 4.5, admin hovers over "week 1" :

Figure 4.5Admin can click on each week no. below the bar graph, it will generate a graph by day within selected week.
For example in Figure 4.6, admin click on Week 2 :

Figure 4.6If admin click on Back to Week button, it will redirect back to the previous graph.
For each graph generated, admin can download them as image or print by using the menu positioned on top right of the graph.
For example in Figure 4.7, admin click on Download PNG Image option from the menu :

Figure 4.7Figure 4.8 is an example of downloaded image :
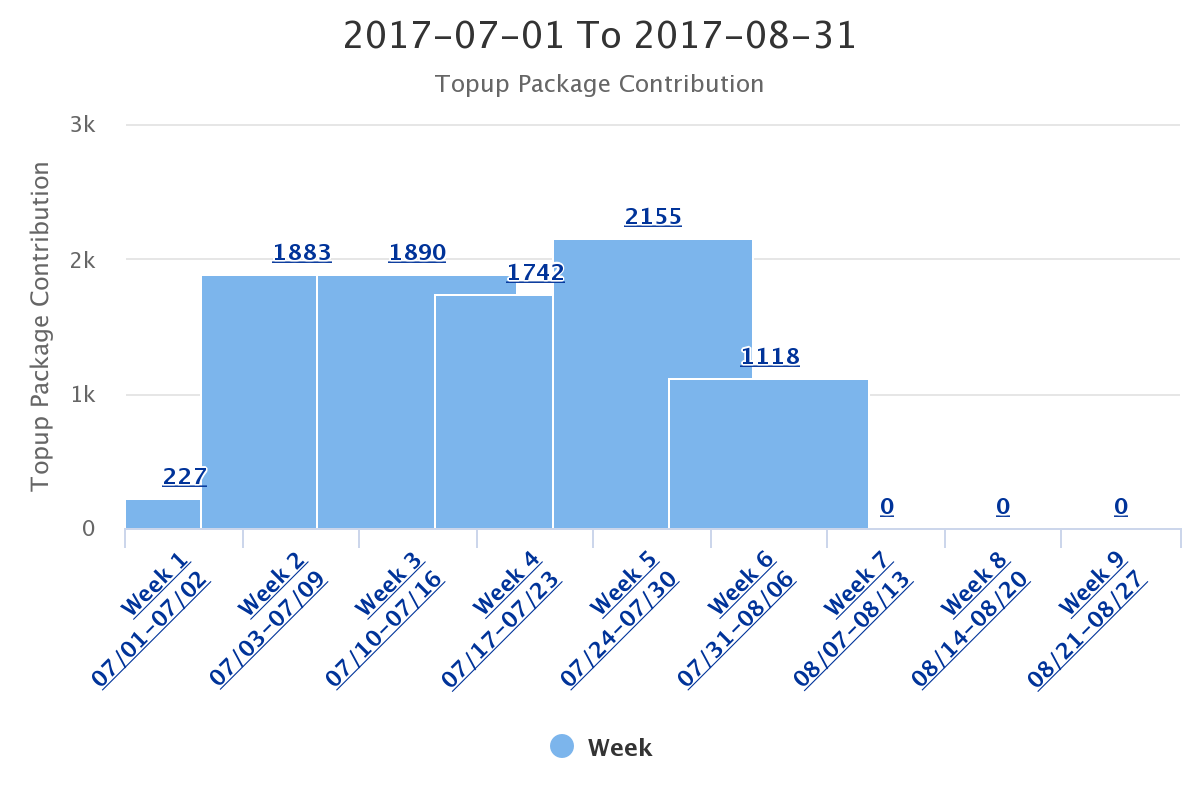
Figure 4.8Admin can generate chart by selecting date range from the search bar. Step i - iv is based on Figure 4.9 :
- i. For example, admin wants to generate topup package chart 01/07/2017 to 31/07/2017
- ii. They need to click on search bar and select Custom option
- iii. Select the date range
- iv. Click Submit button :

Figure 4.9
Admin needs to click on Topup Contribution tab to generate the new chart as shown in Figure 4.10 :

Figure 4.10
III. Topup Ranking
A list of topup record ranked from the largest amount of total topup to the smallest amount.
When admin clicks on Topup Ranking, a Top 10 list of customer with highest amount of topup will be shown like in Figure 4.11 :

Figure 4.11Admin are able to rank them by selecting an option consist of Top 10, Top 50, Top 100 or Top 500 from Select Rank button.
For example in Figure 4.12, admin wants to rank by Top 50, they need to click Select Rank button and select Top 50 :

Figure 4.12Top 50 topup ranking will be displayed as shown in Figure 4.13 :

Figure 4.13If admin click on customer name, they will be redirected to user’s details page
The search bar on top of the table can be used to search a specific customer from the ranking list. Admin can search by customer’s name, email or topup amount.
For example in Figure 4.14, admin types in a customer name, and their detail will be shown :

Figure 4.14
IV. User Topup
A graph showing total amount of topup per day.
When admin click on User Topup tab, a graph will be displayed as shown in Figure 4.15 :
Figure 4.15If admin hovers over each of the bar, they can see details such as date, followed by total amount of topup and total topup times. Figure 4.16 is an example :

Figure 4.16For graph generated, admin can download them as image or print by using the menu positioned on top right of the graph like in Figure 4.17 :

Figure 4.17Figure 4.18 below is a example of downloaded image :
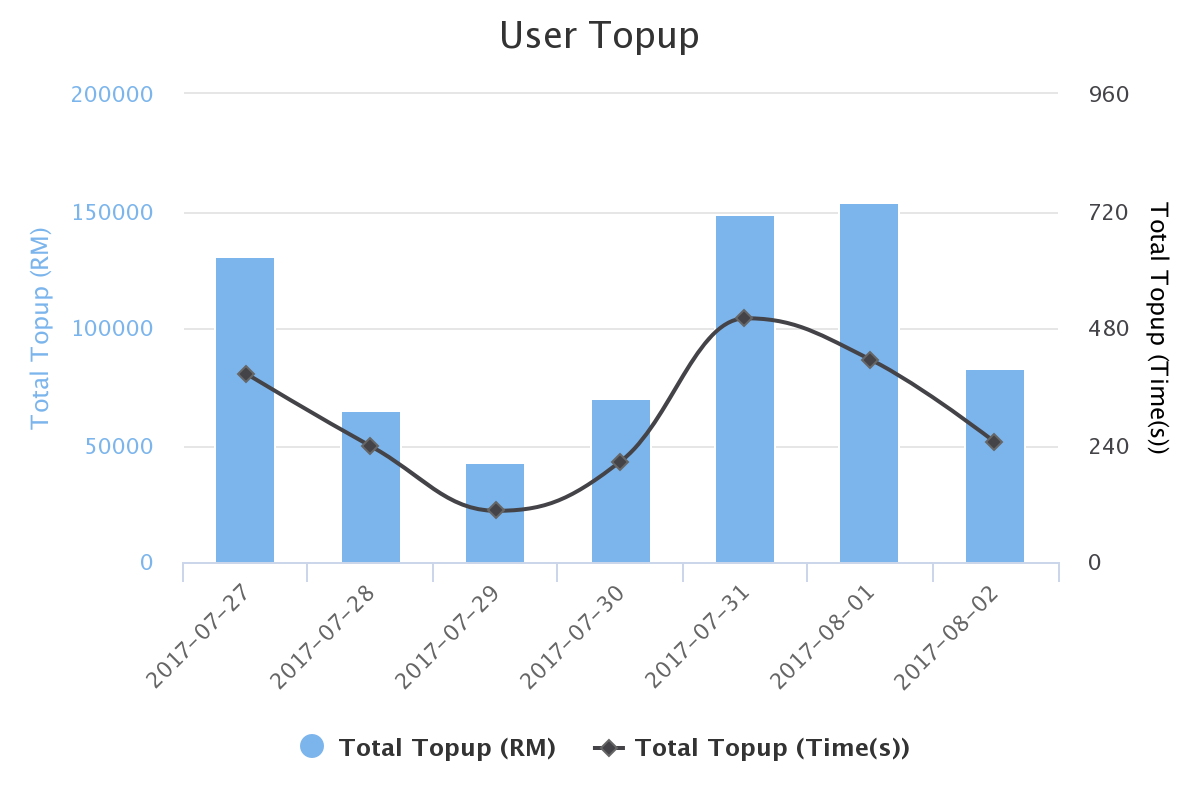
Figure 4.18Admin can generate user topup graph by selecting date range from the search bar. Step i-iv is based on Figure 4.19 :
- i. For example, admin wants to generate user topup graph for 1st June 2017 to 31st July 2017
- ii. They need to click on search bar and select Custom option
- iii. Select the date range
- iv. Click Submit button.

Figure 4.19
Admin needs to click on User Topup tab to generate the new graph as in Figure 4.20 :
 Figure 4.20
V. Credit Distribution
Credit Distribution page shows Credit Distribution chart and its summary as shown in Figure 4.21 below :

Figure 4.21Admin can click on each slice of the pie chart to get more detail of the credit.
For example in Figure 4.22, admin clicks on Online Topup (the blue slice on the pie chart) :

Figure 4.22Admin can click on Back to Credit Type button shown in Figure 4.22 to go back to the previous chart.
Admin can also hover over each slice to see the credit’s type details. For example in Figure 4.23, admin hovers over Online Topup :

Figure 4.23For chart generated, admin can download them as image or print by using the menu positioned on top right of the box.
For example in Figure 4.24, admin clicks on Download PNG Image option from the menu :

Figure 4.24Figure 4.3.4 is an example of downloaded image :

Figure 4.25Admin can generate chart by selecting date range from the search bar. Step i-iv is based on Figure 4.26 :
- i. For example, admin wants to generate credit distribution chart and summary for 15/07/2017 to 22/07/2017
- ii. They need to click on search bar and select Custom option
- iii. Select the date range
- iv. Click Submit button :

Figure 4.26
Admin needs to click on Credit Distribution tab to generate the new chart and summary as in Figure 4.27 :

Figure 4.27
VI. Topup Package
Topup Package page shows topup package pie chart as shown in Figure 4.28 :

Figure 4.28Admin are able to click on the coloured bullets below the pie chart to exclude it from the chart.
For example in Figure 4.29, admin clicks on red bullet [2000], the pie chart will transform to :

Figure 4.29Admin can generate chart by selecting date range from the search bar. Step i-iv is based on Figure 4.30 :
- i. For example, admin wants to generate topup package chart 01/07/2017 to 31/07/2017
- ii. They need to click on search bar and select Custom option
- iii. Select the date range
- iv. Click Submit button :

Figure 4.30
Admin needs to click on Topup Package tab to generate the new chart as in Figure 4.31 :

Figure 4.31Admin can hover over each slice or click them to see the Topup Package details as shown in Figure 4.32 :

Figure 4.32For chart generated, admin can download them as image or print by using the menu positioned on top right of the box.
For example in Figure 4.33, admin clicks on Download PNG Image option from the menu :

Figure 4.33Figure 4.34, is an example of downloaded image :

Figure 4.34
VII. Credit Claimed
A list of credit claimed record by customer.
Figure 4.35 below shows Credit Claim page :

Figure 4.35Admin is able to search customer from the list by entering customer’s name or email
For example in Figure 4.36, admin wants to search customer by email, enter the email in search bar and the result will be displayed in the table :

Figure 4.36The list can also be generated by choosing a date range using the search bar. Step i-iv is based on Figure 4.37:
- i. For example, admin wants to generate credit claim list for 01/06/2017 to 23/06/2017
- ii. They need to click on search bar and select Custom option
- iii. Select the date range
- iv. Click Submit button :

Figure 4.37
Admin needs to click on Credit Claim tab to generate the new chart as in Figure 4.38 :

Figure 4.38
VIII. Monthly Report
Monthly Report shows a graph of monthly sales report as shows in Figure 4.39 :

Figure 4.39Admin can hover over each date to see the details :

Figure 4.40Admin are able to click on the coloured bullets below the graph to exclude it from the graph.
For example in Figure 4.41, admin clicks on blue bullet [Online/Offline Topup], the graph will transform to :

Figure 4.41For graph generated, admin can download them as image or print by using the menu positioned on top right of the box.
For example in Figure 4.42, admin clicks on Download PNG Image option from the menu :

Figure 4.42Figure 4.43 is an example of downloaded image :
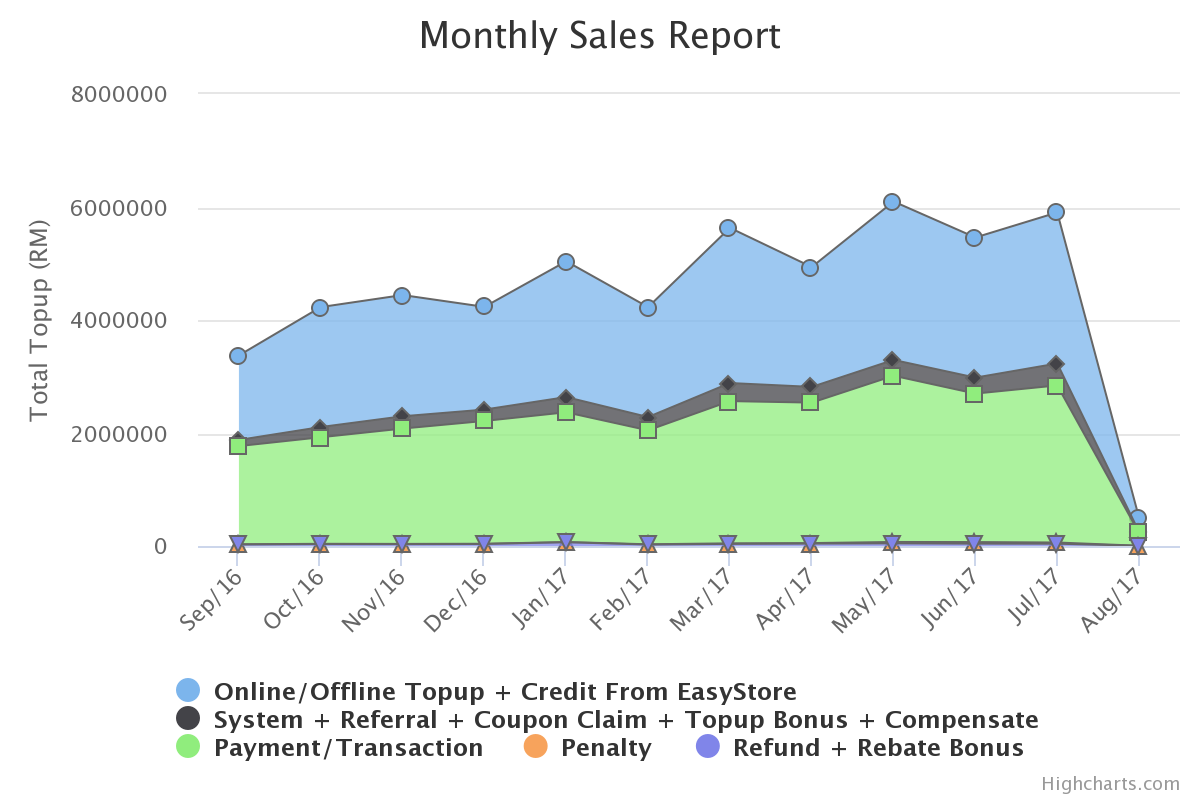
Figure 4.43